Time reports > Time reports for payroll
This manual demonstrates, how Tuntinetti's paid feature "Profitability charts" helps you to estimate the profitability of the company's services. With Profitability charts you are able to see with one glance how much profit or how much loss different employees, projects or customers are making.
There is also an user manual video about the Profitability charts -feature: Profitability charts - Tuntinetti
Profitability charts
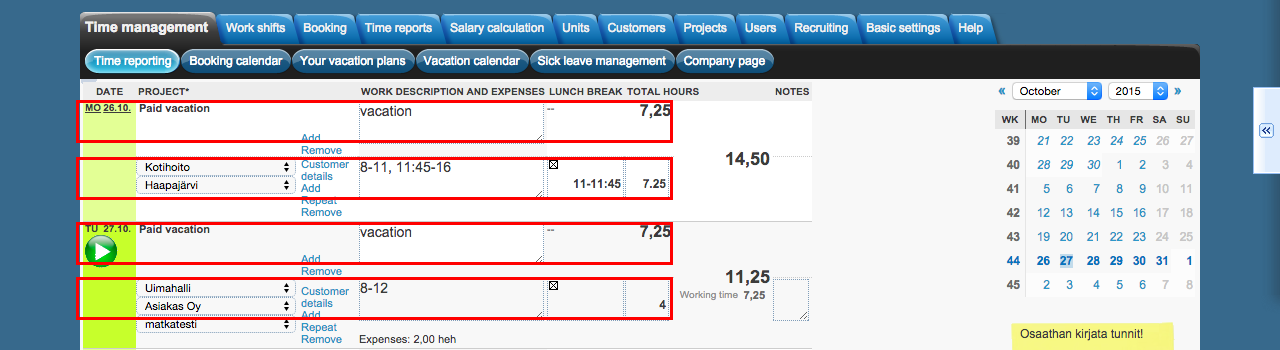
Our example employee has logged hours for two different projects to an example week. The week also has two sick days.
Enabling Profitability charts -feature
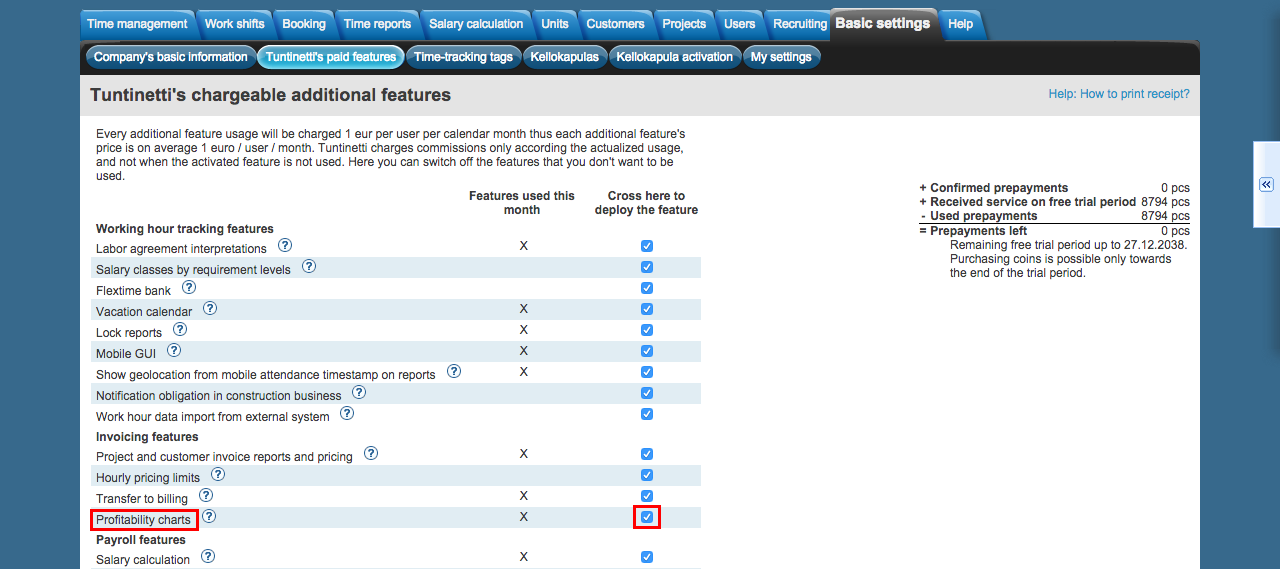
In order to use the charts, the Profitability charts -paid feature needs to be active. You can enable from the Basic settings -tab in the Tuntinetti's paid features -tab.
Activate Profitability charts by checking the box from it's spot at the settings.
Setting up the hourly billing price
Besides the profitability charts -feature you need to set the hourly billing prices for the projects and the employees cost price. Tuntinetti will calculate productivity based on this information.
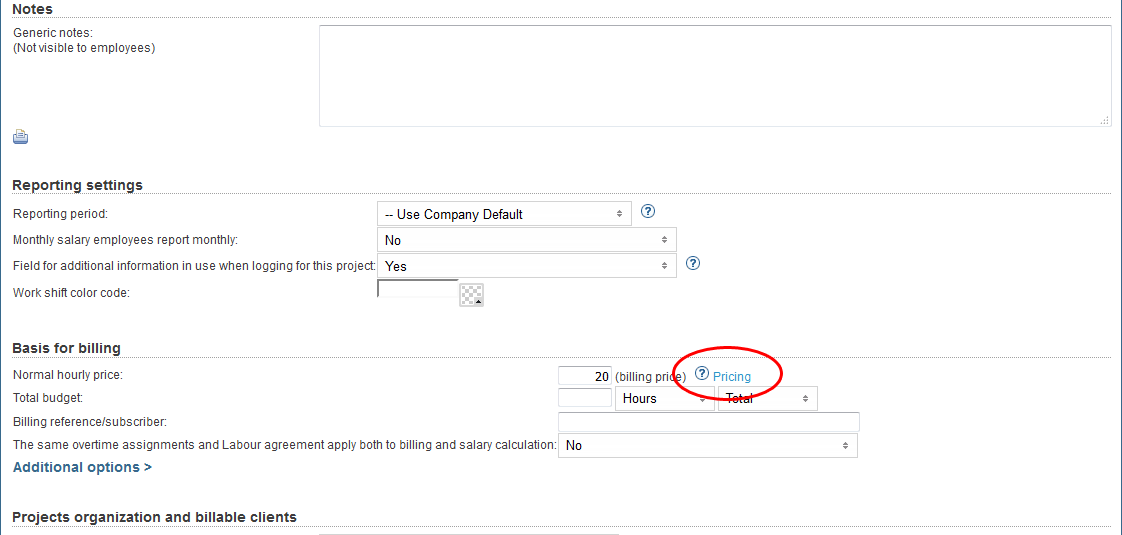
Project's hourly billing price
First choose the right unit and project.
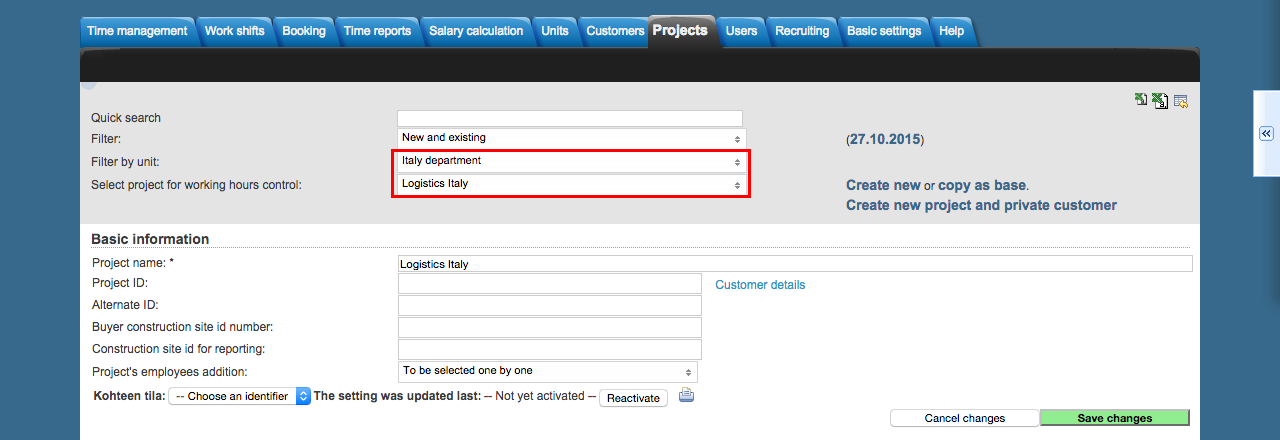
Make sure that the billing price is right. It can be changed in the "Simple hourly price" field.
If the defining of the permanent billing price in not possible but the price changes for example by the time you can also define an accurate price list for the project.
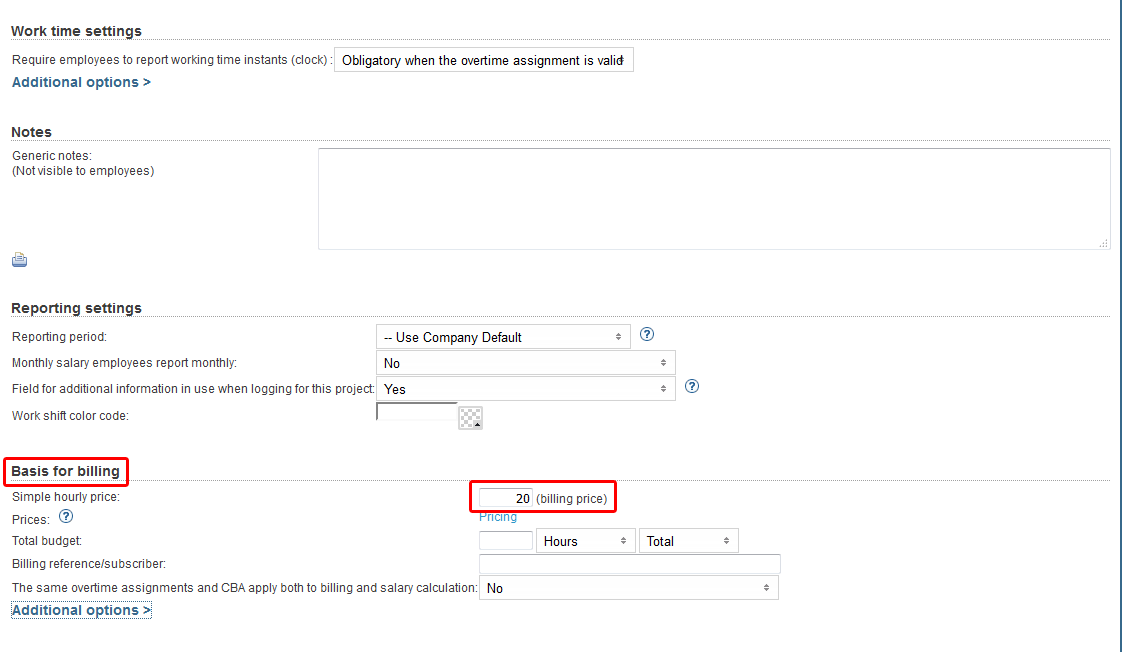
You can either select an existing price list or create a new one. More information about the pricing can be found here: More information about the pricing can be found from "Billing and pricing" page.
Save changes by clicking Save changes -button.
Cost price
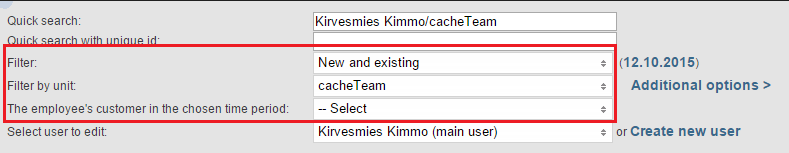
Next lets check that the right kind of cost price has been set to the example employee. This can be done in the Employees -tab.
First select the right employee from the drop-down window. You can filter employees with quick search or by selecting a unit.
You can define the cost price from the employee's employment information at the "Cost" -section.
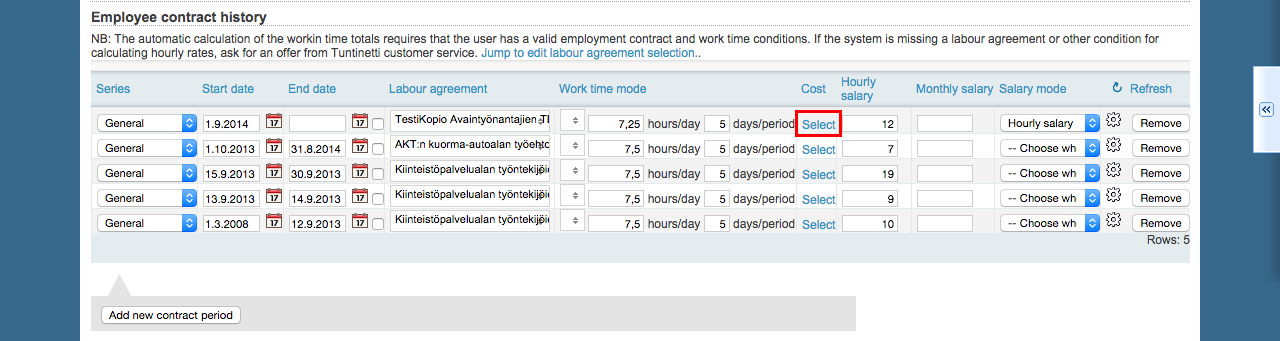
You can set the cost price to be for example the employee's hourly wage combined to the employers side costs.
You can either pick an existing price list or create a new one.
Save changes by clicking Save changes -button.
Profitability chart at the Time reports for payroll
The settings are now right, so lets check out what profitability charts look like at the time reports for payroll.
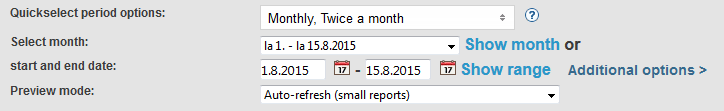
Selecting a time range
First select the period or the time range for the viewing period.
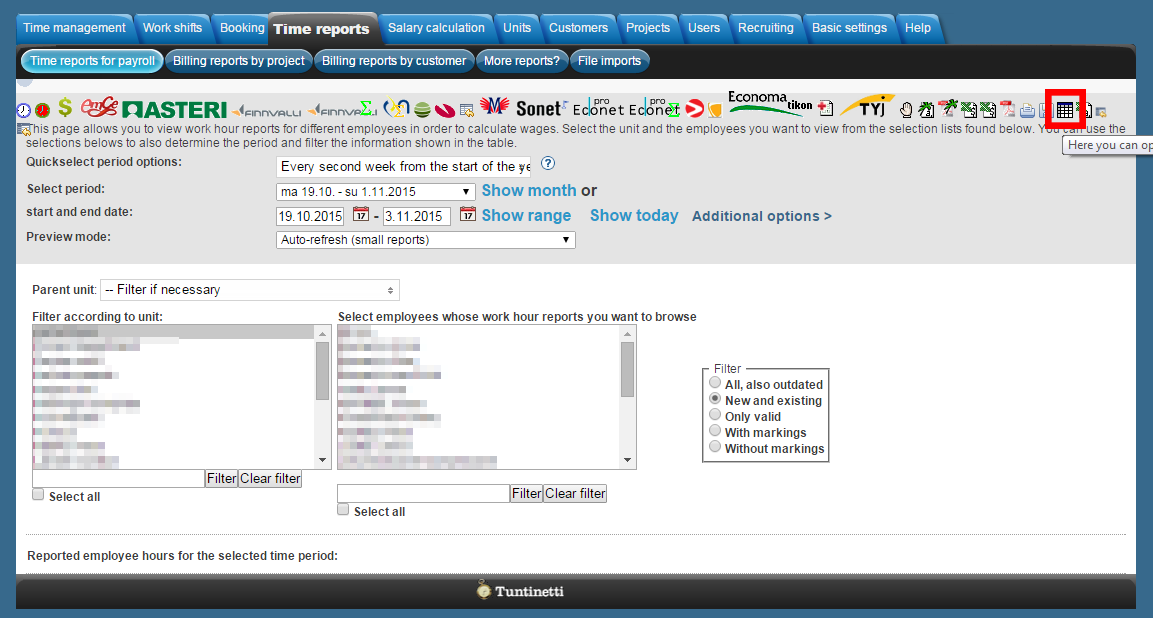
Selecting an employee
Then choose the right employee.

Viewing the profitability chart
Scroll down to view the report.
The profitability chart clearly shows that the profit from the example week was not enough to cover the costs caused by the sick days.
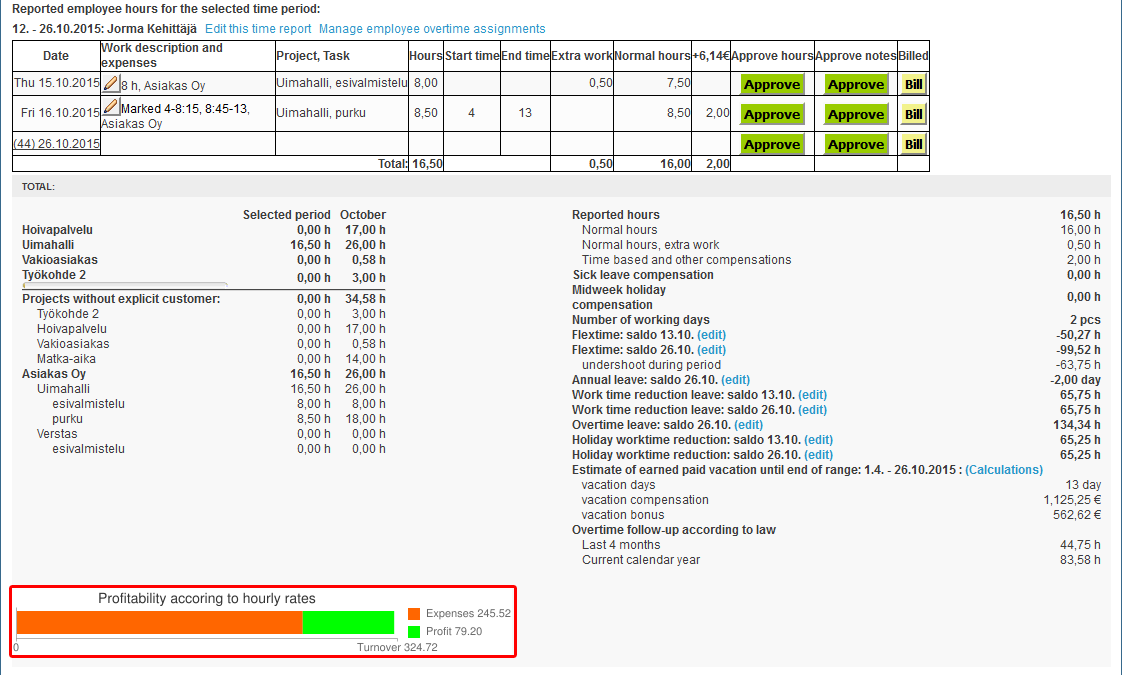
Notice that a single week can be unprofitable on one employees part because of sick days or holidays, but the profitability of the whole projects might have not suffered. Profitability charts make it easy to understand the changes and the wholeness of the projects.
Exporting the information
This information can also be downloaded as an Excel table.
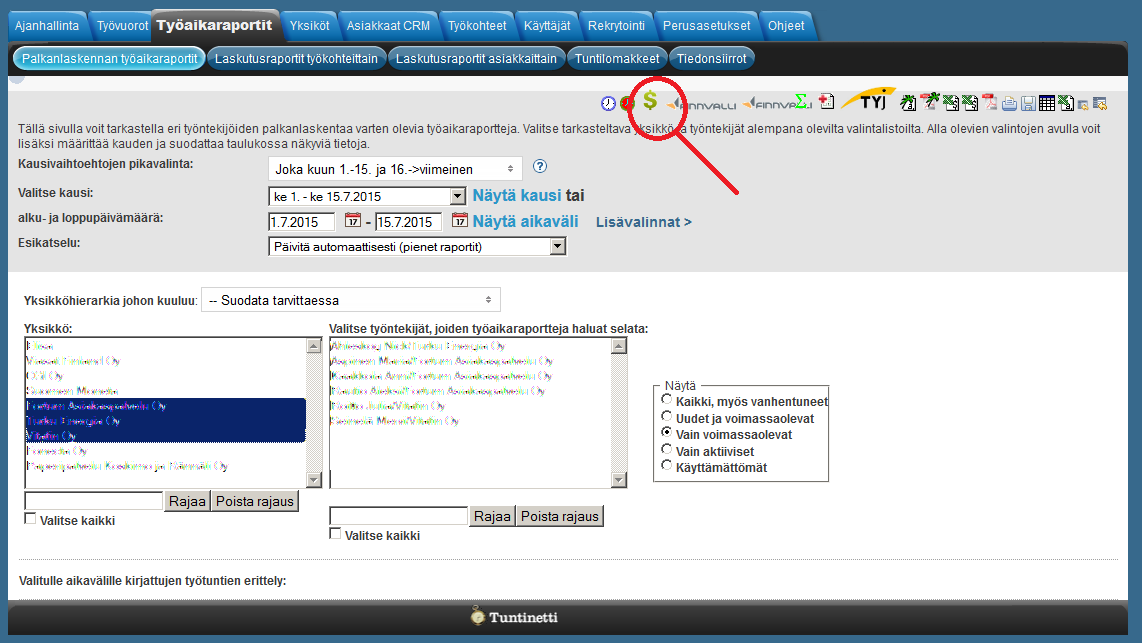
Verification report
Insufficiently priced projects / unprofitable projects can be analysed by clicking the Dollar -button . That downloads a verification report, in which the program analyzes whether the billing options are likely to be right or wrong. This feature can be customized for each customer. Report compare the budget with the work hours of this project. If the hours are missing on the report row, check the project´s settings that the budget has been given.